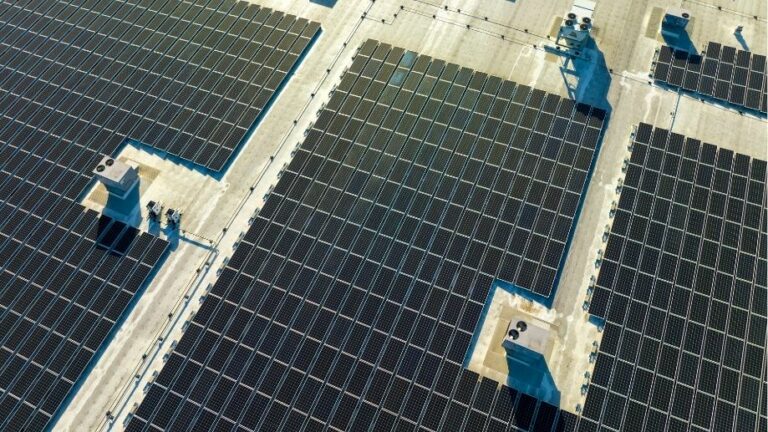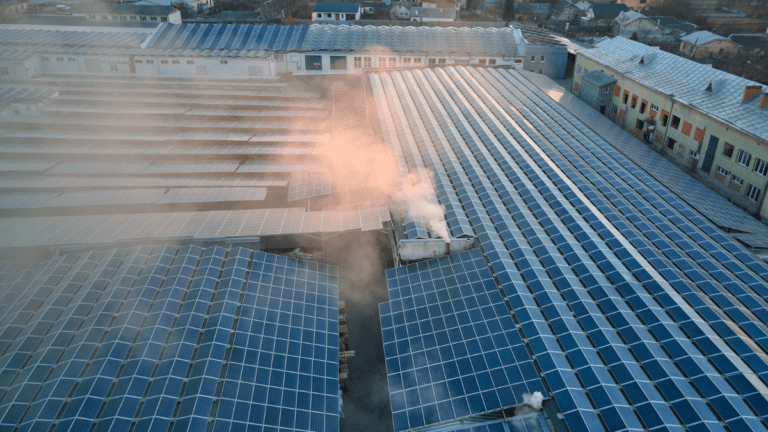

In the utility-scale photovoltaic sector, accurately monitoring the energy produced in a solar farm is not just an option—it is the key to ensuring maximum asset profitability. However, one of the most frequent inquiries from plant operators and owners on our platform revolves around a crucial discrepancy: why does the energy calculated as available by the system not match exactly with the energy ultimately injected and recorded in the electrical grid?
A deep understanding of this divergence between available energy and actual production is essential for evaluating the plant’s technical health, quantifying inefficiencies, and optimizing the company’s predictive maintenance strategies. In fact, for many asset managers, the daily challenge boils down to how to know the actual solar energy produced compared to the potential theoretically promised by their panels.
1. Key Definitions: Available Energy vs. Energy Produced in a Solar Farm
To address this issue, we must first define both concepts with technical precision within the Clever Solar ecosystem:
- Available Energy: The theoretical and actual maximum potential that photovoltaic modules can generate at any given moment, considering incident irradiance levels, cell temperature, and the nominal capacity of the installed equipment.
- Produced Energy: The actual power measured at meters and inverters that is effectively transformed, transported, and supplied to the electrical grid or consumption system.
2. The Mathematical Core: The I-V Curve as an Indicator of Availability
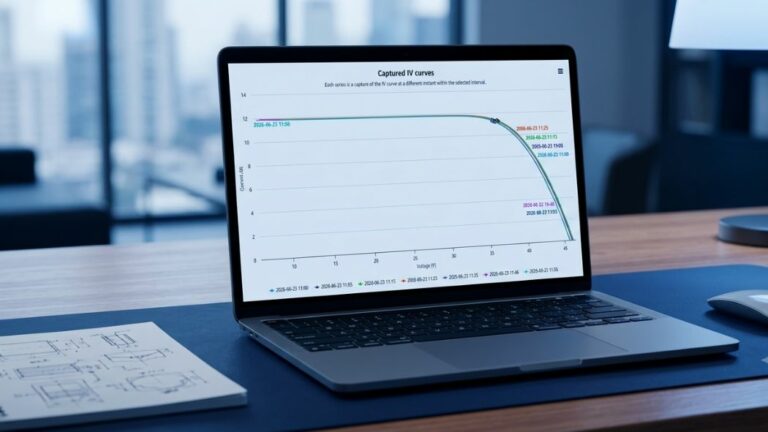
The scientific basis for accurately determining a module’s latent capacity lies in its Current-Voltage (I-V) curve. The I-V curve represents all possible combinations of current and voltage that a string or module can deliver under specific operational conditions.

Through our platform, these curves can be modeled dynamically. By analytically comparing different strings (such as the reference strings R0001C0001N0001 and R0001C0001N0002 shown in our tools), we instantly identify the Maximum Power Point (MPP). The area under this curve establishes the upper limit of available energy. If one of the curves falls slightly below the reference due to degradation, localized soiling, or parameter mismatch, the available energy is recalculated to reflect the actual physical state of the installation. This sets the standard for how to know the potential solar energy produced under any weather scenario.
3. Why Do Differences Arise in Weekly Production?
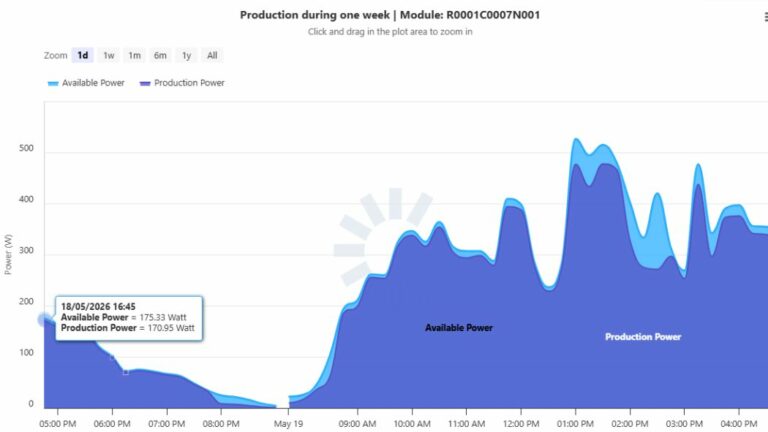
When observing consolidated metrics over medium- or long-term timeframes, such as weekly production charts, it is common to witness a separation gap (usually visible as a light blue area on the monitoring dashboards) between available power and actual production power. In addition to environmental factors, consistently maximizing the energy produced in solar PV installations depends on mitigating internal system losses.

These discrepancies are driven by very clear technical factors:
- Inverter Efficiency Losses: The conversion from direct current (DC) to alternating current (AC) involves efficiencies that typically range between 97% and 98.5%. The remaining percentage is dissipated as heat.
- Inverter Clipping (Power Clipping): During peak hours of the day, the available DC power in the solar field may exceed the inverter’s maximum nominal input capacity. To protect electronic components, the inverter deliberately clips the production curve, creating an unavoidable technical bottleneck.
- Grid Constraints (Curtailment): Occasionally, the electrical system operator forces a reduction in grid injection due to temporary congestion on transmission lines. The plant is available to produce at 100%, but the grid cannot absorb that energy.
- Wiring Voltage Drops: Ohmic losses along DC and AC lines constantly drain the final kWh recorded at the meter.
Optimizing the energy produced in solar PV installations directly depends on the algorithms’ capability to isolate these variables predictively.
4. Conclusion: The Value of Data Transparency
For Clever Solar, displaying this gap with total transparency does not represent a defect in the plant, but rather a powerful diagnostic tool. Knowing exactly the difference between the potential of the I-V curve and the reality of the meter allows O&M (Operations and Maintenance) engineers to act fast.
In the long run, thoroughly auditing the energy produced in a solar farm and cross-referencing it with actual weather data is what sets a high-performance facility apart from one that simply functions. Keeping the relationship between available and produced energy under control is the most direct path toward a guaranteed return on investment.