In the professional photovoltaic sector, optimizing asset performance and reducing downtime is essential to guarantee the return on investment. One of the most powerful and precise diagnostic tools for evaluating the health of modules and strings is the Current-Voltage (I-V) curve analysis. This graph not only measures power output but also acts as an X-ray capable of revealing the internal state of the PV generator without the need to dismantle any equipment.
For operations and maintenance (O&M) professionals and plant managers, understanding the morphology of these curves is key to transitioning from reactive to highly efficient predictive maintenance.
The Perfect I-V Curve: The Reference State
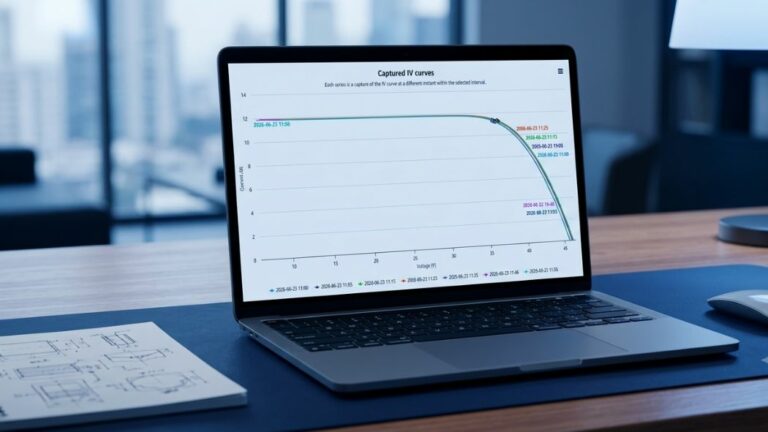
Under optimal operating conditions and uniform irradiance, the I-V curve presents a clean and predictable shape. It begins at its highest point on the vertical axis with the short-circuit current and maintains an almost horizontal trajectory with a slight negative slope as voltage increases. As it approaches the open-circuit voltage, the curve drops sharply and smoothly until it intersects the horizontal axis.
The Maximum Power Point (MPP) is located within this transition, where the product of current and voltage reaches its optimal value. Any deviation, step, or distortion from this ideal geometry is an unequivocal indicator of an inefficiency or a physical fault within the system.

Anatomy of Deviations: What Do the Distortions Mean?
When a string or a module experiences degradation or operational faults, the I-V curve alters its original shape. Below, we analyze the most common morphological anomalies detected in the field:
1. The “Staircase” Effect or Double Slopes (Partial Shading and Mismatch)
The appearance of notches, dips, or “steps” in the upper or middle part of the curve is one of the most common phenomena in commercial and industrial plants. This behavior occurs when there is a significant current mismatch between cells or modules connected in series within the same string.
When current is reduced in one section (for example, due to localized soiling, shading from nearby structures, or faults in specific cells), the module’s bypass diodes activate to allow current to flow from the remaining healthy cells. This activation segments the curve, generating a staircase profile where a considerable portion of the power window is lost.

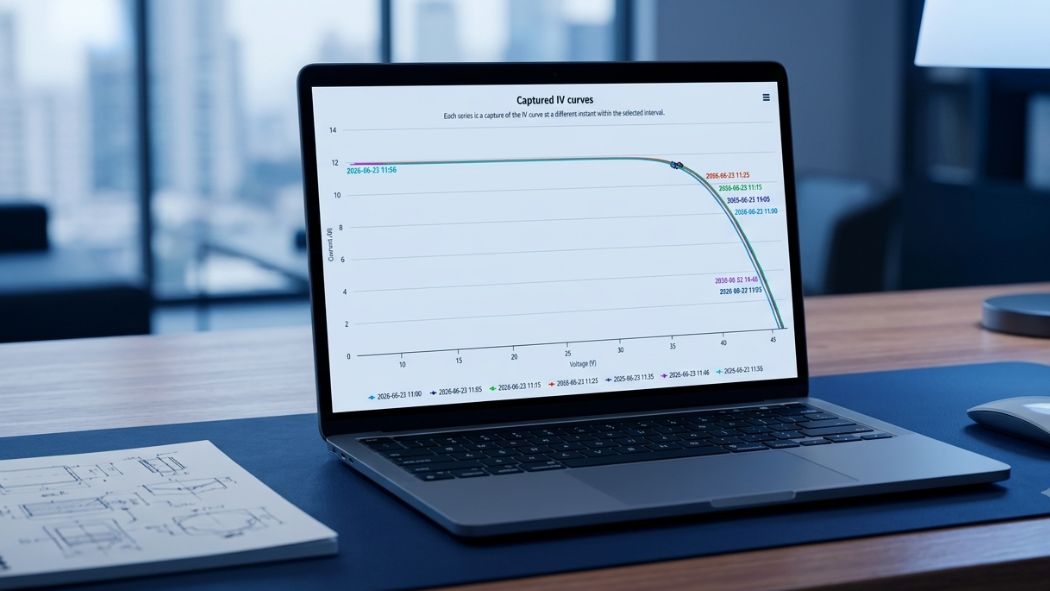
2. Temporal Variations and Irradiance Variability
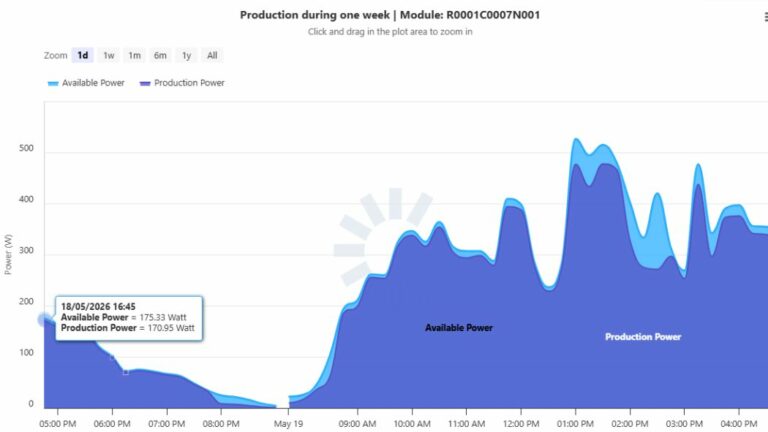
It is crucial to differentiate an intrinsic module defect from a transient environmental factor. When measurements are taken throughout the day, the height of the curve (the current) varies in direct proportion to solar irradiance, while the voltage experiences slight changes inversely proportional to cell temperature.
A clean curve with a lower vertical height simply reflects a measurement taken at a time with lower solar resource (for example, late in the afternoon), which is perfectly normal if properly correlated with data from the reference cell or pyranometer. However, if the curve distorts during an hour of high irradiance, we are facing a technical defect.
3. Alterations in Slopes: Series and Shunt Resistances
Other common deviations modify the extremes of the curve without forming abrupt steps:
- Increase in Series Resistance: Causes the slope of the curve in the area near the open-circuit voltage to become steeper or more “flattened.” This is usually caused by the degradation of intercellular connections, corrosion in the junction box, or faulty wiring.
- Decrease in Shunt or Parallel Resistance: Increases the slope of the upper horizontal section, causing the curve to drop prematurely. This indicates alternative current paths within the cells, typically caused by manufacturing defects or Potential Induced Degradation (PID).
Conclusion for Asset Management
The digitized and automated analysis of I-V curves, such as the one provided by Clever Solar, allows asset managers to identify hidden faults before they translate into massive financial losses in the energy pool. Integrating these measurements into regular plant audits is the most robust strategy to ensure the long-term technical health and economic performance of the photovoltaic asset.